在开发中,不免会遇到一种场景:某天,某某同事向你反馈某个接口最近耗时比较久,针对此类问题,通常需要先定位慢在什么地方,只有清楚了源头,才能从本质上优化程序。
进行性能分析的工具统称性能分析器,主要分为两类:
- 基于事件的性能分析(event-based profiling)
- 统计式的性能分析(statistical profiling)
基于事件的性能分析器会记录所有的事件,而统计式的性能分析器通过抽样方式记录,故而前者往往比后者更准确。
Python标准库提供了基于事件的性能分析工具cProfile供开发者对Python程序进行性能分析,本文以cProfile为例,简述性能分析的常见路子。
性能分析
引用官方文档上的例子:
import cProfile
import re
cProfile.run('re.compile("foo|bar")')
程序输出格式如下:
197 function calls (192 primitive calls) in 0.002 seconds

Ordered by: standard name

ncalls  tottime  percall  cumtime  percall filename:lineno(function)
     1    0.000    0.000    0.001    0.001 <string>:1(<module>)
     1    0.000    0.000    0.001    0.001 re.py:212(compile)
     1    0.000    0.000    0.001    0.001 re.py:268(_compile)
     1    0.000    0.000    0.000    0.000 sre_compile.py:172(_compile_charset)
     1    0.000    0.000    0.000    0.000 sre_compile.py:201(_optimize_charset)
     4    0.000    0.000    0.000    0.000 sre_compile.py:25(_identityfunction)
   3/1    0.000    0.000    0.000    0.000 sre_compile.py:33(_compile)
从输出中可看出,总共有197次函数调用,其中192次原生调用(即不涉及递归调用),调用耗时0.002s。
各个指标说明:
ncalls: 格式为a/b,其中a为总共调用次数,b为原生调用次数,大多数情况下,a与b相等,故而简写tottime:函数调用时间(不包含子函数调用时间)percall:tottime除以ncallscumtime: 函数调用时间(包含子函数调用时间)percall:cumtime除以原生调用次数
另外,从最后一列中也可看出,cProfile的最小统计粒度为函数。
简单使用
Python中进行性能分析会涉及cProfile模块中的Profile类和pstats模块中的Stats类,前者收集数据,后者对收集数据进行加工。
Profile常用接口:
enable():开始收集性能分析数据disable():停止收集性能分析数据create_stats():停止收集性能分析数据并内部记录结果dump_stats(filename):当前结果写入指定文件runcall(func, *args, **kwargs): Profilefunc(*args, **kwargs)
比如将收集性能分析数据写入文件:
import cProfile


def fib(n):
    if n <= 1:
        return n
    return fib(n - 1) + fib(n - 2)


pr = cProfile.Profile()
pr.runcall(fib, 20)
pr.dump_stats('fib.pstat')
数据源已经有了,还需要对数据源进行进一步加工,这便是Stats类做的事情,Stats类常见接口:
dump_stats(filename): 当前结果写入文件print_stats(*restrictions):输出当前结果sort_stats(*keys):指定排序列
Stats(*filenames or profile, stream=sys.stdout)支持文件名或profile对象为入参,并可通过指定stream参数来更改print_XXX函数输出流,例将输出流更换为BytesIO:
import cProfile
import io
import pstats


def fib(n):
    if n <= 1:
        return n
    return fib(n - 1) + fib(n - 2)


pr = cProfile.Profile()
pr.runcall(fib, 20)

stream = io.BytesIO()
ps = pstats.Stats(pr, stream=stream)
ps.print_stats()

print "BytesIO content is:"
print stream.getvalue()
可视化
虽然我们可以通过在命令行查看函数调用关系及耗时,不过始终感觉还是没有可视化工具方便(看个人喜好)。
平时以PyCharm为开发工具,而PyCharm中刚好又内置了cProfile可视化工具,编写如下程序:
import cProfile
import time
def fib(n):
if n <= 1:
return n
return fib(n - 1) + fib(n - 2)
def delay(n):
time.sleep(n)
def say():
print "Welcome to test visual tool."
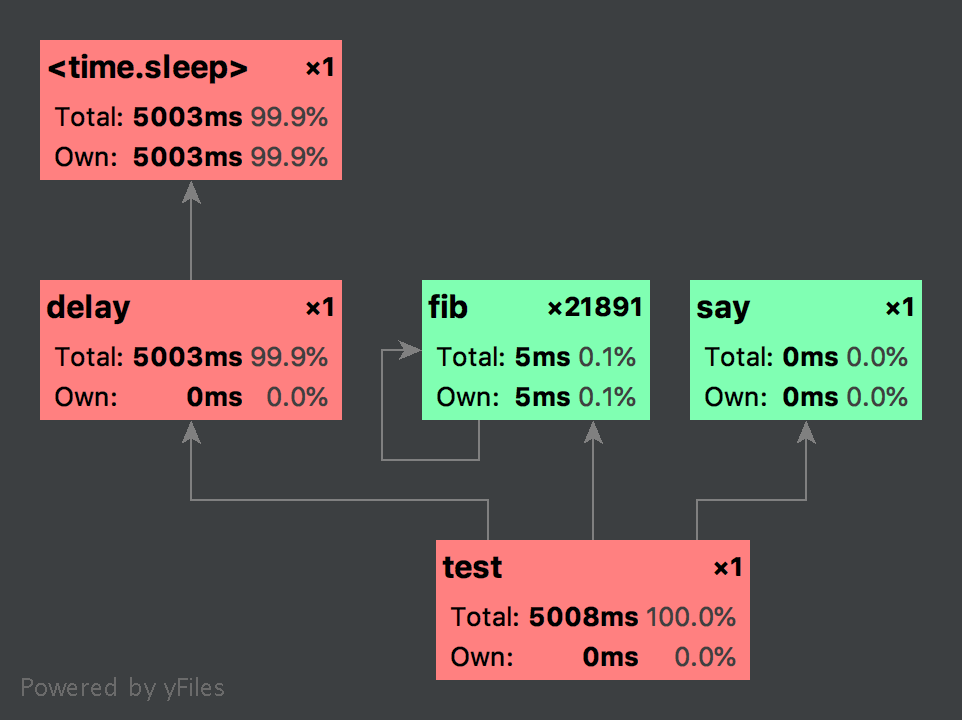
def test():
fib(20)
delay(5)
say()
pr = cProfile.Profile()
pr.runcall(test)
pr.dump_stats('demo.pstat')
在PyCharm菜单栏中选择Tools下的Open CProfile snapshot,打开当前目录下demo.pstat文件,得到如下图: